> d<-matrix(c(0,0,1,1,1 ,0,1,1,0,2,0,3,1,0,1,6,0,0,0,2,1,8,5,2,0),ncol=5,nrow=5まずは列ラベルを設定する.
> d
[,1] [,2] [,3] [,4] [,5]
[1,] 0 0 0 6 1
[2,] 0 1 3 0 8
[3,] 1 1 1 0 5
[4,] 1 0 0 0 2
[5,] 1 2 1 2 0
> colnames(d)<-c("A","B","C","D","E")お次は行ラベルを設定する.
> d
A B C D E
[1,] 0 0 0 6 1
[2,] 0 1 3 0 8
[3,] 1 1 1 0 5
[4,] 1 0 0 0 2
[5,] 1 2 1 2 0
> rownames(d)<-c("A","B","C","D","E")グラフに変換する.
> d
A B C D E
A 0 0 0 6 1
B 0 1 3 0 8
C 1 1 1 0 5
D 1 0 0 0 2
E 1 2 1 2 0
> g<-graph.adjacency(d,weighted=TRUE)画像に書き出す.
> png("c:/tmp/myplot.png",width=400, height=400,pointsize=12)
> plot(g)
> dev.off()
null device
1

> E(g)$weight一応,グラフ情報もみておく.
[1] 6 1 1 3 8 1 1 1 5 1 2 1 2 1 2
> summary(g)
Vertices: 5
Edges: 15
Directed: TRUE
No graph attributes.
Vertex attributes: name.
Edge attributes: weight.
今度は特定のエッジを削除してみる.
重みが5以下のエッジを削除してみよう.
> g2<-delete.edges(g,E(g)[weight<=5])グラフ情報をみると,
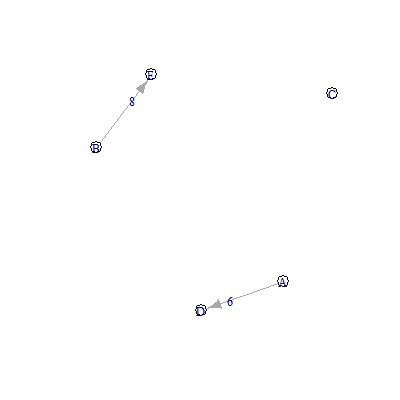
> summary(g2)描画してみよう.
Vertices: 5
Edges: 2
Directed: TRUE
No graph attributes.
Vertex attributes: name.
Edge attributes: weight.
> png("c:/tmp/myplot.png",width=400, height=400,pointsize=12)
> plot(g2,layout=layout.fruchterman.reingold,vertex.color="white",vertex.label=V(g2)$name,edge.label=E(g2)$weight,vertex.size=10)
> dev.off()
null device
1
次数0のノードができてしまった.
こいつを削除しよう.
> g2<-delete.vertices(g2,which(degree(g2)<1)-1)もう一回,書き出してみる.
> summary(g2)
Vertices: 4
Edges: 2
Directed: TRUE
No graph attributes.
Vertex attributes: name.
Edge attributes: weight.
> png("c:/tmp/myplot.png",width=400, height=400,pointsize=12)
> plot(g2,layout=layout.fruchterman.reingold,vertex.color="white",vertex.label=V(g2)$name,edge.label=E(g2)$weight,vertex.size=10)
> dev.off()
null device
1

0 件のコメント:
コメントを投稿